European renewable energy policy*
GIOVANNI RIVA♦ - MAURO ALBERTI◊
Abstract
The European Union
(EU) was one of the strongest proponents of the Kyoto Protocol for reduction of
greenhouse gases emissions, and assumed, for the first commitment period,
2008-2012, an emission reduction obligation of 8 % (below the 1990 level).
European Union's strategy to reach greenhouse emission reductions in energy
sector, one of the most significant for Kyoto compliance, relies on three major
pillars: (1) more efficient use of energy, especially as regards end uses, (2)
increased utilization of renewable energy, and (3) accelerated development and
deployment of new energy technologies – particularly next-generation fossil fuel
technologies that produce near-zero harmful emissions (e.g. by means of CO2
sequestration techniques).
Biomass constitutes the main renewable energy source on which European States
may rely to fulfil their targets of green energy consumption and green
electricity generation. Several studies have thus been conducted in the last
years to evaluate the potential of energy generation from biomass. For Western
Europe (‘‘OECD Europe’’) the potential contribution of primary biomass to energy
demand could be from 10 to 20 %.
European policy and associated legislation issued to effectively promote
renewables and biomass development is based on several mechanisms that, taken
altogether, can foster the comprehension of renewable technologies, the
spreading of knowledge about renewable energy and the realization of projects.
Keywords: energy policy, renewable energy, biomass, incentives.
1 INTRODUCTION
Energy policy came to the forefront in Europe with the oil crisis of the
1970s. Before then, governments had largely invested in electrification and had
created large integrated monopolies that generated, transmitted and distributed
electricity.
In most countries in Western Europe governments were primarily engaged in
nuclear power development. In some countries governments also involved
themselves in the supply of oil, coal and/or natural gas. Renewable energy
sources, with the exception of hydropower in countries having significant
hydropower potential (e.g. Italy, Sweden, etc.), attracted very little interest.
In the last thirty years the situation has changed. Nowadays, there are
considerable concerns in Europe over security of energy supply, environmental
issues, competitiveness of the European economies, and regional development.
Imports of oil and natural gas are expected to grow from, respectively, 80 % and
46 % of total consumption in 2000 to 93 % and 73 %, respectively, in 2020 [DG
TREN, 2003]1. Increased use of energy carriers produced from domestic,
renewable flows of energy is one way to reduce import dependence. The other
major option is to increase the efficiencies of energy and material use [Jochem
et al., 2002].
Support for renewable energy technology development has also been seen as a way
to build a competitive industry that will have a global market, as alternatives
to conventional energy sources are increasingly sought. For example, development
at regional and local level could be supported by the use of land-intensive
renewables, primarily biomass.
The European Union (EU) was one of the strongest proponents of the Kyoto
Protocol for reduction of greenhouse gases emissions, and assumed, for the first
commitment period, 2008-2012, an emission reduction obligation of 8 % (below the
1990 level). Although this represents a significant first step, much deeper
global emission reductions would have to follow to achieve the objective of the
United Nations Framework Convention on Climate Change (UNFCCC)2. To
achieve the first commitments, the EU member states have shared the
responsibilities between member states in the so-called European bubble3.
European Union's strategy to reach greenhouse emission reductions in energy
sector, one of the most significant for Kyoto compliance, relies on three major
pillars: (1) more efficient use of energy, especially as regards end uses, (2)
increased utilization of renewable energy, and (3) accelerated development and
deployment of new energy technologies – particularly next-generation fossil fuel
technologies that produce near-zero harmful emissions (e.g. by means of CO2
sequestration techniques).
Increased use of renewable energy is thus deemed as extremely important to
reduce dependence on extra-UE energy sources as well as reduce the environmental
challenges European Union is facing. Another important target is the development
of an industrial (for technologies and infrastructures creation) and service (for
energy production and distribution) sector which could contribute to make EU
economy grow in the future4.
2 EU RENEWABLE ENERGY POLICIES
2.1 Energy situation in the European Union
Primary energy consumption in the EU-15 was 62.8 EJ (1500 million tonnes of
oil equivalent, Mtoe) in 2001.
Contributions from different sources for 1990 and 2000 are shown in Table 1,
together with projections in a baseline scenario to 2030. Electricity generation
was 2600 TWh in 2000 and is, in this scenario, projected to grow to 3800 TWh in
2030.
In the baseline scenario for the EU-15, presented by DG TREN [2003], population
is expected to grow from 379 million in 2000 to 389 million in 2030, remaining,
thus, essentially stable. Gross domestic product (GDP) is projected to grow from
8.545 trillion euros in 2000 to 16.920 trillion euros in 2030, corresponding to
an average growth rate of 2.3 % per year. The energy intensity is projected to
decline from 7.1 to 4.3 PJ per million (M) euros in the same period. The
contribution of renewables would remain below 10 %, missing the target set by
the EU. Estimates of International Energy Agency (IEA, World Energy Outlook
2002) for EU are more conservative as regards GDP, projected to reach 14.689
trillion euros in 2030 (average growth rate of 1.9% per year), and also as
regards decline of energy intensity, which is deemed to be around 5 PJ per
million (M) euros in 2030. The result is, thus, roughly the same as regards
primary energy demand projected for 2030, i.e. about 72 EJ in DG TREN estimates
and 74-75 EJ in IEA estimates5.
Table 1: Gross inland energy consumption (in EJ) in the European Union (EU-15),
and projected consumption in the baseline scenario (DG TREN 2003).
|
|
1990 |
2000 |
2010 |
2020 |
2030 |
|
Solids |
12.69 |
8.88 |
6.99 |
7.54 |
9.34 |
|
Oil |
22.86 |
24.58 |
25.00 |
25.42 |
25.33 |
|
Natural gas |
9.30 |
14.19 |
19.09 |
22.19 |
23.28 |
|
Nuclear |
7.58 |
9.34 |
9.63 |
8.33 |
7.54 |
|
Electricity |
0.08 |
0.17 |
0.13 |
0.13 |
0.13 |
|
Renewables |
2.76 |
3.68 |
5.11 |
5.82 |
6.45 |
|
Total |
55.31 |
60.84 |
65.99 |
69.38 |
72.02 |
|
of which |
|
|
|
|
|
|
Hydro |
0.93 |
1.16 |
1.18 |
1.24 |
1.26 |
|
Biomass |
1.24 |
1.51 |
2.14 |
2.45 |
2.75 |
|
Waste |
0.50 |
0.78 |
1.2 |
1.10 |
1.06 |
|
Wind |
0.004 |
0.08 |
0.56 |
0.76 |
0.99 |
|
Solar and others |
0.004 |
0.013 |
0.06 |
0.10 |
0.19 |
|
Geothermal |
0.09 |
0.138 |
0.16 |
0.17 |
0.20 |
|
Total renewables |
2.76 |
3.68 |
5.11 |
5.82 |
6.45 |
|
Renewables as % of totale inland consumption |
5.0 |
6.1 |
7.8 |
8.4 |
8.9 |
The Renewable Energy White Paper (EU, 1997), indeed, stated that indigenous
renewable sources of energy would have to play an important role in improving
energy supply security. It set an indicative target of 12% for the share of
renewables in the EU’s primary energy portfolio in year 2010, more than double
this share in 19956.
Renewables exploitation is required to reduce dependence on oil and natural gas.
The supply of gas in Europe risks creating a new situation of dependence7.
Geographic gas import diversification is presently quite poor with Russia and
Algeria accounting for 41% and almost 30% of the EU’s natural gas imports. A
number of Member States, and in particular most new member countries, are
entirely dependent on a single gas pipeline that links them to a single supplier
country.
2.2 Renewable Energy Policies
After a delicate negotiation process, EU renewable8 energy
policy-making culminated in the adoption of two renewables-specific directives.
The first [EU, 20019] provides a Union framework for the promotion of
electricity from renewable sources, while the second [EU, 200310]
addresses the promotion of biofuels and other renewable (automotive) fuels. We
will refer to these directives in what follows as the RES-E Directive and the RF
Directive11 respectively.
On the other hand, there is no regulatory framework yet to accelerate the growth
of the market for RES heating and cooling. However, the development of such a
framework may build on the foundations laid by the Directive on the Energy
Performance of Buildings [EU, 200212] and the Directive on the
Promotion of Co-generation of Useful Heat and Electricity [EU, 200413].
European policy and associated legislation issued to effectively promote
renewables development is based on several mechanisms that, taken altogether,
can foster the comprehension of renewable technologies, the spreading of
knowledge about renewable energy and the realization of projects. Among these
mechanisms, the most important, which are considered in all of the
above-mentioned directives, are the following:
- economic incentives (e.g. feed-in tariffs, quota obligations - i.e. green
certificates, tendering/bidding schemes, investment subsidies and fiscal
measures);
- promotion of research activity on innovative technologies (e.g. gasification
technology for biomass)
- definition of clear and effective planning procedures for renewable plants
siting (e.g. guidelines for regional/local planning);
- communication of the value of green energy to users (e.g. guarantee of origin
for renewable electricity).
Although an effective development of renewables sector must derive from the
combination of all the above-mentioned factors, economic incentives constitute,
needless to say, the main assistance that renewable energies must be given to
become competitive with respect to conventional energies.
Substantial cost reductions in the past few decades in combination with adoption
of subsidies by Member States' governments have made a number of renewable
energy technologies (RETs) competitive with fossil-fuel technologies in specific
applications14 (Table 2).
Table 2: Comparison of costs for electricity generation, Conventional vs.
renewable technologies. Source: Macchi-Chiesa-Bregani, 2003.
|
|
|
Installation cost
|
Capital recovery factor
|
Availability |
Fuel costs |
O&M (two components: electricity dependent and capacity dependent) |
Electricity costs |
|
| η | euro/kW | Hours/yr | Euro/kWh | euro/kWh | euro/kW-yr | euro/kWh | ||
|
Coal (Ultra Super Critical) cycles |
0,435 |
1.100 |
0,150 |
7.250 |
~ 0,01 (1) |
0,0045 |
18 |
~ 0,04 |
|
Repowering combined cycle |
0,555 |
350 |
0,150 |
8.000 |
~ 0,025 (1) |
0,0025 |
9 |
~ 0,035 |
|
New combined cycle |
0,565 |
430 |
0,150 |
8.000 |
~ 0,025 (1) |
0,0025 |
9 |
~ 0,036 |
|
Cogeneration natural gas |
0,605 |
500 |
0,150 |
6.000 |
~ 0,023 (1) |
0,0055 |
7 |
~ 0,031 |
|
Wind generator |
- |
1.000 |
0,150 |
2.000-2.500 |
- |
- |
88 |
0,07-0,10 |
|
Biomass |
0,25 |
2.000 |
0,150 |
7.000 |
0,01 - 0,06 (2) |
0,0045 |
10-15 |
0,01 - 0,12 |
|
Nuclear |
- |
2.000 |
0,133 |
8.000 |
~ 0,004 |
0,0080 |
32 |
~ 0,05 |
|
(1) Price
for carbon and natural gas is assumed respectively as 1.37 and 3.90
euro/GJ LHV (natural gas 0,14 euro/Nm3) |
||||||||
Economic incentives established by national governments, however, have to comply
with European Union market-based approach for industrial and service activities.
In the case of renewable energies, a level playing-field for European renewable
energy suppliers has been regarded as essential to foster a swift market-based
penetration of intra-Union renewable sources of energy in the EU. This was
ensured by a Union-wide regulatory framework on state aid.
In 2001 the European Commission adopted an amended set of Union guidelines for
assessing whether aid administered by member states for environmental protection
is or is not compatible with the common market [EU, 2001]15. The
guiding principle in assessing aid for renewable energy, contained in the
Community Guidelines on State Aid for Environmental Protection, is that the
beneficial effects of such measures on the environment must outweigh the
distorting effects on competition [Point 5]16.
However, state aid for renewables should result in an overall increase of
renewable energy sources and not in shifts from one renewable energy technology
to another or from one member state with less favourable renewable energy
incentives to another with more favourable state aid in place for renewable
energy sources.
3 EU BIOMASS POLICY
As recalled in previous paragraphs, biomass constitutes the main renewable
energy source on which European States may rely to fulfil their targets of green
energy consumption and green electricity generation.
Biomass, however, must be clearly classified according to sector of derivation
and type of materials concerned. A correct classification is extremely important
because different types of biomass have diverse characteristics that determine
the cost of supply and other management and logistics aspects, as well as the
real availability of these materials as fuels. A simple classification is
presented in Table 3.
Table 3: Classification of biomass types and resources.
|
Supply sector |
Type |
Example |
Utilisation sector |
|
Agriculture |
Dry lignocellulosic agricultural residues |
Straw |
Tradeable, electricity and heat |
|
Dry lignocellulosic energy crops |
Short-rotation wood, miscanthus |
Tradeable, electricity and heat |
|
|
Livestock waste |
Manure |
Non-tradeable, waste |
|
|
Oil, sugar and starch energy crops |
Oil seeds for methylesters |
Tradeable, transportation |
|
|
Sugar/starch crops for ethanol |
Tradeable, transportation |
||
|
Forestry |
Forestry byproducts |
Wood blocks, wood chips from thinnings |
Tradeable, electricity and heat |
|
Industry |
Industrial residues |
Industrial waste wood |
Tradeable, electricity and heat |
|
Fibrous vegetable waste from virgin pulp production and from production of paper from pulp, including black liquor |
Non-tradeable, waste |
||
|
Wet cellulosic industrial residues and slaughter house waste |
---- |
||
|
Industrial products |
Pellets, bio-oil (pyrolysis oil), ethanol, biodiesel |
Tradeable, electricity and heat, transportation |
|
|
Waste |
Parks and gardens |
Prunings, grass |
Tradeable, electricity and heat |
|
Contaminated waste |
Demolition wood |
Non-tradeable, waste |
|
|
Biodegradable municipal waste |
Non-tradeable, waste |
||
|
Biodegradable landfilled waste, landfill gas |
Non-tradeable, waste |
||
|
Sewage sludge |
Non-tradeable, waste |
To understand biomass (and, more in general, renewable energies) potential, the
following definitions are considered:
- Theoretical potential: determined by energy flow.
- Technical potential: determined by technical constraints.
- Realistic potential: determined by non-technological factors/constraints.
- Realisable potential at a certain point in time: takes into account maximum
market growth rates over all countries.
Every step results in a reduction of the potential, due to various constraints.
This is illustrated in Figure 1.
Several studies have been conducted in the last years to evaluate the potential
of energy generation from biomass.
Taking into account geographical and land-use conditions as well as technical
and economic concerns, Hoogwijk [2004] investigated the global and regional
potential of biomass, wind and solar PV energy. The results on biomass are shown
in Table 4. For Western Europe (‘‘OECD Europe’’) the figure ranges from
10 to 20 %, and for Eastern Europe from 30 to 50 %.
For other regions in the world, notably Oceania, the former USSR, Canada, South
America and East Africa, much higher ratios (above 1) are found, indicating that
in the longer term most of the biomass used in Europe might originate from these
regions.
| Theoretical potential | |
| ↓ |
← Technical feasibility |
| Technical potential |
← Land Availability |
| ↓ |
← Acceptability & planning |
| Realistic potential |
|
| ↓ |
← World-wide industry production rate |
| Realisable potential |
|
Figure 1: Methodology for definition of potentials
Table 4: Potential future contribution of primary biomass to world
energy consumption and consumption in Western and Eastern Europe
|
|
Waste and residues in
2020-2050 |
Energy crops in
2050 (EJ/yr)[2] |
|||
|
|
|
below |
below 2 $/GJ |
below 4 $/GJ |
Total geographical potential |
|
Western Europe[4] |
NA[3] |
0 |
3-6 |
9-15 |
9-16 |
|
Eastern Europe[5] |
NA[3] |
0 |
6-8 |
6-9 |
8-9 |
|
Total world |
30-90 |
8-16 |
129-272 |
177-438 |
302-675 |
[1] Estimates from literature; the figures include forest
and crop residues, in some studies also animal and municipal solid wastes.
[2] Assuming different scenarios on land use following the marker scenarios A1,
A2, B1 and B2 of Nakicenovic et al., [2000].
[3] No figure available.
[4] Includes Andorra, Austria, Denmark, Faroe Islands, Finland, France, Germany,
Gibraltar, Greece, Holy See, Iceland, Ireland, Italy, Liechtenstein, Luxembourg,
Malta, Monaco, Netherlands, Norway, Portugal, San Marino, Spain, Sweden,
Switzerland, and United Kingdom.
[5] Includes Albania, Bosnia-Herzegovina, Bulgaria, Croatia, Czech Republic,
Hungary, Macedonia, Poland, Romania, Slovakia, Slovenia, and Yugoslavia.
Some six years have lapsed since the publication of the White Paper. Recent
RES-energy supply trends suggest that the White Paper indicative target of 12%
RES contribution to total primary energy supply in the EU by year 2010 will most
likely be under-achieved by a big margin.
Hitherto, with the notable positive exceptions of foremost wind energy and
possibly also – if certainly to a lesser extent - geothermal, most renewable
energy branches cannot live up to the high ambition level enunciated in the
White Paper. The White Paper projections for year 2010 suggest that, among other
renewables, biomass would contribute the lion’s share, 5.65 EJ or 8.5%, to total
primary energy supply.
For this to happen, biomass energy supply would have to increase by 3.77 EJ over
year 1995’s level. The White Paper provides the following elaboration for this
increment:
- Biogas (methane gas obtained by anaerobic digestion of livestock manure,
agro-industrial effluents, sewage treatment, landfills) →
0.63 EJ.
- Solid fuels (wood and agricultural residues) →
1.26 EJ.
- Energy crops dedicated to biofuels production (rape seed, sugar beet, etc.)
→ 0.75 EJ.
- Solid cellulosic energy crops (short rotation forestry, miscanthus, etc.) for
heat and/or power → 1.13 EJ.
Recent trends suggest the following. The biogas ‘target’ will not be met, mainly
because of a phasing out of landfills, subsequent to recently introduced EU
legislation fostering waste incineration.
Biogas production used for heat or electricity stood at 0.01 EJ (2304 ktoe) in
2000. The UK, a country with as yet a fair amount of landfills, is the leading
country in the EU.
The EU’s odd 100 million hectares of forested area yielded 1.98 EJ (47.3 Mtoe)
of primary solid biomass energy in year 2000. EurObserv’ER (EurObserv’ER, 2002)
deems 2.60 EJ (62 Mtoe) in 2010 achievable, an amount possibly on the optimistic
side. Yet it is far below the 4.19 EJ (100 Mtoe) needed for meeting the White
Paper target.
The White Paper expectations of biofuels will not be met in spite of the adopted
Renewable Fuels Directive (above mentioned). Production in 2000 stood at 0.03 EJ
(191 kt ethanol and 700.6 kt biodiesel). The indicative target of the recently
adopted Renewable Fuels Directive boils down to 0.73 EJ (17.48 Mtoe), comparable
to the White Paper projection of 0.75 EJ (18 Mtoe). As a result, all indications
suggest that biomass is set to lag behind the White Paper projections by a
considerable margin.
3.1 Incentive schemes
The policy instruments that are in place in the different Member States to
promote generation of electricity from renewable sources (and, then, biomass)
are all based on two main principles. The instruments either affects the supply
or the demand of renewable electricity, and the focus either on the production
of electricity or on the installed capacity of renewable electricity plants (see
Figure 2)
|
|
Generation based (kWh) |
|
|
|
Supply side |
Feed-in tariffs |
Quota obligations/
green certificates |
Demand side |
|
Investment subsidies |
(Quota obligations) |
||
|
|
Capacity based (kW) |
|
|
Figure 2: Classification of incentive schemes.
Within this categorisation, there are basically three main
instruments to promote renewable electricity. These instruments are feed-in
tariffs, quota obligations in combination with a green certificate system, and
tendering/bidding schemes. Besides the three main instruments there are
complementary mechanisms possible, like investment subsidies and fiscal measures.
Feed-in tariffs
Feed-in tariffs are a commonly used policy instrument for the promotion
of renewable electricity production. The term feed-in tariff is used both for a
regulatory, minimum guaranteed price per unit of produced electricity to be paid
to the producer, as well as for a premium in addition to market electricity
prices. Regulatory measures are usually applied to impose an obligation on
electricity utilities to pay the (independent) power producer a price as
specified by the government. The tariff may be supplemented with subsidies from
the state. The level of the tariff is commonly set for a number of years to give
investors security on income for a substantial part of the project lifetime.
Many different adaptations of the instrument are applied.
A feed-in tariff can be based on the avoided cost of the utility that has the
purchase obligation, or on the end price to the consumer. However, the level of
the tariff need not have any direct relation with either cost or price, but can
be chosen at a level to motivate investors for green power production.
Quota obligations/green certificates
Quota obligations are used to impose a minimum production or consumption
of electricity from renewable energy sources. The government sets the framework
within which the market has to produce, sell, or distribute a certain amount of
energy from renewable sources. The obligation is imposed on consumption (often
through distribution companies) or production. Governments may choose to
establish 'technology bands' in order to protect technologies from strong
competition by lower cost options. The quota can usually be traded between
companies to avoid market distortions. A tradable green certificate is needed
for this system. These green certificates provide an accounting system to
register production, authenticate the source of electricity, and to verify
whether demand has been met.
Bidding systems
Bidding procedures can be used to select beneficiaries for investment
support or production support (such as through feed-in-tariffs), or for other
limited rights- such as sites for wind energy. Potential investors or producers
have to compete through a competitive bidding system. The criteria for the
evaluation of the bids are set before each bidding round. The government decides
on the desired level of electricity from each of the renewable sources, their
growth rate over time, and the level of long-term price security offered to
producers over time. The bidding is accompanied by an obligation on the part of
electricity providers to purchase a certain amount of electricity from renewable
sources at a premium price. The difference between the premium and market price
is reimbursed to the electricity provider, and is financed through a
non-discriminatory levy on all domestic electricity consumption. In each bidding
round the most cost-effective offers will be selected to receive the subsidy.
The mechanism therefore leads to the lowest cost options.
Investment subsidies
Investment subsidies can help to overcome the barrier of a high initial
investment. This type of subsidy is commonly used to stimulate investments in
less economical renewable energy technologies. Investment subsidies are usually
20-50% of eligible investment costs, but in some cases subsidy is given over the
total eligible investment sum, however within the limitations of the Community
guidelines on State aid for environmental protection. Loans with a low interest
rate can also be considered as investment subsidies.
Fiscal measures
Some EU countries support renewable electricity by means of the fiscal
system. These schemes may take different forms, which range from rebates on
general energy taxes, rebates from special emission taxes, proposals for lower
VAT rates, tax exemption for green funds, to fiscal attractive depreciation
schemes, which must be in line with the Community guidelines on State aid for
environmental protection.
It must be said that all of these mechanisms are permitted within the contest of
the Renewable Electricity Directive17.
Feed-in tariffs are permitted provided that it is demonstrated (as it has been
the case for German Law on Renewable Electricity) that they are correctly
defined to favour development of renewable technologies without excessive state
aid and they are progressively modified (i.e. reduced) to take into account
renewable technologies improvement and cost reductions.
In recent years, however, several EU Member States have assessed the possibility
of introducing a green certificates mechanism18. Member States choices are
presented in Table 5.
Table 5:EU countries with feed-in tariffs or quota systems (green
certificates) in December 2004. Sources: Bechberger et al. 2003; Reiche 2003;
Reiche 2002; www.aroges.org
|
Country |
Feed-in tariff |
Quota obligation + certificate trading |
Biomass incentive (cent€/kWh) |
||
|
Austria |
● |
|
Solid biomass and waste with large biogenic fraction: 10.2-
16.0 € cents /kWh (10-2
MW), 6.5 € cents /kWh (hybrid plants)
MW) 4.0-5.0 € cents /kWh
(hybrid plants)
€ cents /kWh |
||
|
Belgium |
●1 |
● |
Biomass and other RE: 2 € cents/kWh (Certificate minimum price) |
||
|
Cyprus |
● |
|
Biomass, landfill and sewage: 6,3 € cents/kWh |
||
|
Czech Republic |
● |
|
Biomass and biogas: 8 € cents/kWh (year 2003) |
||
|
Denmark |
● |
○ |
Solid Biomass: A settlement price of 4 € cents/kWh is guaranteed for a period of ten years. Additionally and as a guarantee these plants receive 1 € cent/kWh in compensation
for an RE certificate. |
||
|
Estonia |
● |
|
Electricity price for renewable energy 1.8 times the residential price, so the price for renewable energy is: 5,2 € cents /kWh. This price is paid for 7 years for biomass. |
||
|
Finland |
● |
|
Biomass: 4,2 € cents /kWh |
||
|
France |
● |
|
Biomass: Standard rate of 4,9 € cents/kWh, premium up to 6 €
cents/kWh
premium up to 6 € cents/kWh
cents /kWh for 15 or 20 years. A tendering system is in place for renewable energy installations > 12 MW. |
||
|
Germany |
● |
|
Biomass: up to 500 kW: 10 € cents/kWh, up to 5 MWp: 9 €
cents/kWh, up to 20 MWp:
8,6 € cents/kWh, form 501 kW to 5 MW: 6,6 € cents/kWh |
||
|
Greece |
● |
|
Feed-in tariff of about 7,8 € cents/kWh on the islands and 7 € cents/kWh on the mainland |
||
|
Hungary |
● |
|
Energy generated from renewable energy resources must be purchased between 6 and 6,8 € cents/kWh |
||
|
Ireland |
Tendering scheme |
|
Target purchase
prices |
||
|
Italy |
|
● 2 |
Certificate prices up to 9.74 €ct/kWh, 2004. (Certificates are issued only for plants producing more than 50 MWh per year.) |
||
|
Latvia |
● |
|
The annual purchase tariff for small hydro power as well as for power plants using waste or biogas is set at the average electricity sales tariff. |
||
|
Lithuania |
● |
|
Average energy
prices since February 2002: |
||
|
Luxembourg |
● |
|
Biomass, biogas: 2.5 up to 3 MW, 10 years |
||
|
Malta |
|
|
--- |
||
|
Netherlands |
● |
|
Mixed biomass and waste:
Small-scale biomass < 50 MWe |
Tariff 2004 5.5 8.2 |
Tariff 2005 2.9 7 9.7 |
|
Poland |
|
● |
Not yet enforced |
||
|
Portugal |
● |
|
Tariffs (€ cents/kWh)
Wood Biomass (residual)
|
year 2005 7.2 7.2 7.1 7.2 |
new tariff 10.5 10 10 7.2 |
|
Slovenia |
● |
|
Biomass up to 1
MW: 6.98 €c/kWh; |
||
|
Slovakia |
|
|
--- |
||
|
Spain |
● |
|
RES producers may choose between a fixed preferential tariff or a (variable) premium price on top of the market price. Investment support is also provided. Tariffs are specified for plants 50MW. |
||
|
Year 2003 (€ cents/kWh)
|
premium price 3.32 2.51 |
feed-in tariff 6.85 6.05 |
|||
|
Sweden |
|
● |
Certificates prices will be settled by supply and demand. Forecasts show expected prices in the range of 1.3 – 1.6 € cents/kWh for certificates traded. |
||
|
United Kingdom |
|
● |
Green certificate system: the non-compliance ‘buy-out’ price for 2003-2004 is set at approx 4.5 € cents/kWh (buy- out price will be annually adjusted in line with the retail
price index) from the climate change levy on electricity of approx. 0.63 € cents/kWh) |
||
● = deployed promotion instrument; ○ = introduction is planned; 1
only in the Flanders region and only for photo-voltaic; 2 up to April
2005, the value of green certificates has been established by the GRTN, which
could also issue uncovered green certificates (with no counter-value of
renewable energy production) in order to prevent potential system malfunctions
in the initial phase of the market due to considerable demand and insufficient
availability of green certificates. Thus, in the first phase, the maximum price
of a certificate has been equal to the value of those issued by the GRTN. The
sale price of the green certificates held by the GRTN was 8.24 € cents /kWh in
2003, 9.74 € cents /kWh in 2004; 3 Primary biomass: that is used
directly from nature; the clearest examples are the energy crops, the forest and
the agricultural residues (pruning, straws...). Secondary biomass, still being
matter of biological origin, is the result of transformation processes made by
men: residues of wood industry, slurry and other animal residues, organic waste,
etc.
3.2 Standardisation of biofuels
Standardisation of biofuels is an important factor to foster the development
of the market of biomass for energy.
Bioenergy can be produced from resources of different origin and chemical
composition. These can be classified by their origin in the following broad
areas:
» Agricultural products (such as energy crops) and
residues (such as straw and olive stones from the agro-food industry).
» Forestry
products (such as wood from thinnings, short rotation forestry) and residues (such
as tops and branches left in the forest) and also residues, wastes, products and
by-products from forest-based industries and operations such as bark, sawdust
and fibre sludge
» Waste
streams generated by the consumer society (such as sorted biodegradable
fractions of municipal and industrial solid waste and sludge).
Solid biofuels and/or dedicated energy crops may contain substances that can
create significant pollution if used in inappropriate systems. Examples are
chlorine in straw (from fertilisation with potassium chloride) and forest
products from coastal locations (sea spray), cadmium in energy crops like
willows (natural Cd in the soil is effectively taken up by the crop) or heavy
metals. Biofuels with a “natural” content of chlorine may produce dioxins during
thermo-chemical conversion and can show similarities with fuels derived from
several waste streams. With this knowledge about biofuels, it is extremely
important to identify and define different properties, standardise the accepted
levels and have the right methods and tools to measure these properties.
Traditionally biofuels have been used in the form of fuel-wood for heating and
cooking in households. The forest-based industries like the sawmills and the
pulp and paper industries have always used residues such as bark, sawdust,
shavings, black liquor and fibre-products for in-house energy production.
As a result of national energy policies aiming at sustainable development,
biofuels are traded between producers and users. An international trade has been
developed between the EU countries and also with countries outside the EU. At
present, the international trade inside the EU has reached almost 1 Mtoe/year.
The trade covers products like wood chips, wood pellets, wood-logs and
by-products from sawmills.
The trade of biofuels for energy production is under development and the market
is increasing rapidly at the moment. A major problem for a dynamic and
sustainable market is that the quality of the traded biofuels varies extremely
among the various producers. The consequence is that the users are reluctant to
buy fuels when the quality and composition can not be specified and the
manufacturers of equipment do not guarantee their equipment for biofuels that do
not follow a specification.
The absence of European standards is a major barrier to develop the market for
solid biofuels. A market which is necessary for the European Union to reach its
targets for the deployment of bioenergy.
Standardisation of solid biofuels will help to regulate the market and to
provide confidence to fuel producers and fuel users. Standards on solid biofuels
with respect to quality and properties will make it possible to find the optimum
utilisation of different biofuels with respect to protecting the environment. In
addition, standards on solid biofuels will improve the efficiency of biomass
utilisation because the users will be able to procure fuels of a quality
corresponding to the specifications of their equipment.
3.2.1 Mandate to European Committee for Standardization - CEN
Based on the above issues, the European Commission proposed a mandate to CEN for
the elaboration of standards in the field of solid biofuels.
The Mandate (M 298, European Commission, 2000) was assigned taking into
consideration that:
1. waste is defined in Directive 75/442/EEC on waste,
2. incineration of municipal waste is regulated by Directives 89/369/EEC and
89/429/EEC for new and existing municipal incineration plants, respectively
3. the European Commission examined in the Directive 75/442/EEC under which
conditions a waste ceases to be a waste and becomes a product
In the Mandate it is underlined that wastes or products not originating from the
sources in the list below are explicitly excluded from this mandate:
»
Products from agriculture and
forestry
»
Vegetable waste from
agriculture and forestry,
»
Vegetable waste from the food
processing industry,
»
Wood waste, with the exception
of
o wood
waste that may contain halogenated organic compounds or heavy metals as a result
of treatment;
o treated wood originating from building and demolition waste
» Cork waste
Description of the mandate
The Commission assigned to CEN to produce a coherent set of European
standards for solid biofuels with the aim of satisfying the requirements
mentioned above, namely the creation of a stable market for solid biofuels and
for the related equipment.
In CEN Technical Committee 335 – Solid Biofuels, the foreseen standards are
organised under such a structure that they would provide adequate and clear
delineation among the various types of fuels, their origin and their fitness for
use in specific applications19. The standards structure should give the market
and the legislative authorities the possibility to distinguish between renewable
and fossil fuels. The standards should define sampling and measuring procedures
for those pollutants and impurities that are expected to be present in the
biofuels. This is allowing regulatory authorities and end users to assess the
technical and environmental aspects of solid biofuels combustion.
Standards
More in detail the required standards refer, among the others, to:
- terminology, definitions and descriptions
- fuel specifications and classes
- fuel quality assurance
- sampling, sample preparation, preparing sampling plans and sampling
certificates
- bulk density, particle density
- content of volatile matter
- ash melting behaviour
- particle size distribution
- density of pellets and briquettes
- durability, mechanical durability of pellets and briquettes
- moisture content
- ash content
- calorific value
- oxygen (O) content
- carbon, hydrogen and nitrogen content
- sulphur and chlorine content
- water soluble content of chloride, sodium and potassium
- major elements content (Al, Si, K, Na, Ca, Mg, Fe, P and Ti)
- minor elements content (As, Ba, Be, Cd, Co, Cr, Cu, Hg, Mo, Mn, Ni, Pb, Se,
Te, V and Zn)
3.3 Agricultural and forestry policies
3.3.1 Agriculture
As explained in previous sections, Agriculture and Forestry are the main
sectors-providers of biomass. In these contexts, energy use competes with other
uses (food, feed).
For instance, there are crops like oil-plants (rapeseed, sunflower), roots and
beets (for alcoholfuels), cellulose plants (cereales, high grasses, trees) that
may have an energy destination20. Besides, farmers or transformers produce offals
from plant use, but also from animals (slaughter offals like fat and meals). And
the gasification of manure is possible.
Recently, CAP reform has increased market orientation of agriculture. Better
opportunities are then provided for farmers to adapt production to increasing
demand for biomass. With the new Regulation (1782/200321 ), EU’s
farmers will get a single payment per farm and they can, in principle, produce
whatever they want. Also energy crops grown on set-aside land will receive
payments under the new Single Payment Scheme. Energy crops grown on non
set-aside22 land will receive payments under the new Single Payment
Scheme plus the new energy crops payment, consisting of € 45/ha. This applies
for a maximum area of 1.500.000 ha. The aid will only be granted in respect of
areas whose production is covered by a contract between the farmer and the
processing industry except where the processing is undertaken by the farmer on
the holding. All crops (except sugar beet) are eligible for support, including
some multi-annual. However, the system is not applicable within simplified
premium system in new Member States
The results of the first year (2004) of application of energy crops support
(45€/ha for a maximum area of 1.500.000 ha) are presented hereafter23:
- EU 25: around 300.000 ha (of 1.5 millions)
- France 129.000 ha
- Germany 109.000 ha
- UK 30.000 ha
- Sweden 13.600 ha
- Spain 7.000 ha
- Denmark 4.900 ha
- Austria 4.100 ha
- Finland 3.500 ha
- Slovenia 300 ha
- Less than 300 ha: Irland, Netherlands, Belgium, Italy, Greece, Portugal
3.3.2 Forestry
Since the publication by FAO and UN/ECE of the Temperate and Boreal Forest
Resources Assessment in 2000 ([TBFRA 2000]), a full set of comparable data on
forest cover and forest cover change is now available for Europe, CIS24,
North America, Australia, Japan and New Zealand. All figures that follow are
based on TBFRA 2000. They are only applicable to forests and not to “other
wooded land” (OWL)25.
EU forests cover approximately 113 million hectares, or 36 percent of the land
area, while EU OWL accounts for another 23 Mha (TBFRA 2000). Between the
countries exist large differences in forest cover, ranging from 9 (Ireland) to
over 72 percent (Finland).
The forest area in the ten new EU Member States covers 23.5 million hectares, or
33 percent of their land area. Poland is most rich in forests – in absolute
terms (9 million hectares). In relative terms the forest cover ranges from 1
(Malta) to 55 (Slovenia) percent. The new EU Member States have a share of 17
percent of forests in the European Union of the twenty-five (EU25).
EU forests are expanding: in 1990-2000 the area under forest cover in Europe has
increased by 3.40 M ha, i.e. an annual increase in area of 340.000 ha (TBFRA
2000, based on country sources for different multi-year periods around 1995).
50% of this increase derives from new plantations, while 50% originates from
natural expansion of the forests.
The ratio between yearly fellings and net annual increments is, on average,
about 60% (in EU 15), 302 and 483 million cubic meters, respectively. In some
Member States, however, this ratio is below 40%. In the new Member States the
ratio is slightly higher, i.e. 64.8 percent (125 million cubic meters of net
annual increment and 81 million cubic meters of annual fellings).
65-70% of forests are in private ownership in EU 15 whereas 25% are privately
owned in New EU Member States. 75% in New EU Member States is state owned while
only 30-35 % in the EU15.
Overall in the European Union, forest holdings are rather small, especially
compared to agriculture lands holdings. In many of the Central and Eastern New
EU Member States countries up to almost 90 percent of private forest owners will
own forest of less than 3 ha in size (MCPFE, 2003). This poses specific problems
for a cost-effective and a sustainable management of the forest resources.
Transition to a market economy and the simultaneous emergence of private forest
ownership will need considerable change of the foundations of forest policy
formulation and implementation.
Aspects that are emerging in the last years are limited market for small sized
wood (because of thinning delay) and availability of land due to CAP reform (in
upland areas)
Forestry biomass supply scenario is presented in Table 6.
Measures that can be thought of to successfully accomplish reported targets are:
- Classic afforestation (no result expected before 2010 )
- Fast growing plantations ( + 21 Mmł/y by 2010, much more in medium term)
- Dedicated energy crops (very effective in short term but few examples > 15-20
mł/ha/y)
- Adapting management in existing forests to raise output:
o 75 %
util. rate >100 Mmł/y extra output
o removing more logging residues
o facilitating pre-commercial thinnings
- Changes in use of small roundwood (possible competition for resource > higher
prices / effects on global market positions )
- Land use changes: (Long Term option)
o
restoring degraded forest (+ 100 Mmł/y)
o making OWL productive ( + 8 Mmł/y)
- Production Forestry Policy: + 90 Mmł/y (long term)
o 25 %
nature conservation
o 50 % multifunctional
o 25 % production only
Table 6: Expected biomass inputs for RES E + RES H / 2010. Source: DG
Environment.
|
|
Total Biomass Demand |
Covered by agric. sector |
Covered by wood |
Of which wood residues |
Of which forest biomass |
Total forest biomass demand |
|
|
Mm3/a |
|
|
|
|
Mm3/a |
|
RES E in 2002 |
38 |
8% |
92% |
77% |
23% |
8 |
|
RES H in 2002 |
103 |
1% |
99% |
88% |
12% |
12 |
|
Current total |
142 |
4 |
138 |
117 |
21 |
21 |
|
Share |
100% |
3% |
97% |
82% |
15% |
15% |
|
|
|
|
|
|
|
|
|
BAU Scenario |
|
|
|
|
|
|
|
RES E in 2010 |
81 |
27% |
73% |
75% |
25% |
15 |
|
RES H in 2010 |
114 |
5% |
95% |
87% |
13% |
14 |
|
Total |
214 |
28 |
186 |
151 |
35 |
35 |
|
Share |
100% |
13% |
87% |
71% |
16% |
16% |
|
|
|
|
|
|
|
|
|
VP Scenario |
|
|
|
|
|
|
|
RES E in 2010 |
180 |
45% |
55% |
58% |
42% |
41 |
|
RES H in 2010 |
133 |
12% |
88% |
82% |
18% |
21 |
|
Total |
313 |
97 |
216 |
154 |
62 |
62 |
|
Share |
100% |
31% |
69% |
49% |
20% |
20% |
BAU= Business As Usual
VP = Voluntary Policy
Finally, it must be emphasized that forestry biomass has to be somehow
integrated in energy policies, by, among different possibilities:
• raising incentives for afforestation, thinning
• favourable tax regimes for biomass energy
• increasing co-operation among forest owners
• designation of biomass production areas
• specific support schemes for energy crops /coppice.
3.4 Authorisation procedures, waste definition, co-firing
European Policies and Legislation on renewable energy takes into account the
often difficult process of authorisation that power plants may face26.
As regards biomass, problems in the authorization procedures are usually
associated with the fact that it is not always possible to draw a clear
distinction between biomass and waste.
Waste Incineration Directive (2000/76/EC) only excludes from its scope plants
which utilize some typologies of forestry, agriculture and industry residues:
(a) Plants treating only the following wastes:
(i) vegetable waste from agriculture and forestry,
(ii) vegetable waste from the food processing industry, if the heat generated is
recovered,
(iii) fibrous vegetable waste from virgin pulp production and from production of
paper from pulp, if it is co-incinerated at the place of production and the heat
generated is recovered,
(iv) wood waste with the exception of wood waste which may contain halogenated
organic compounds or heavy metals as a result of treatment with wood
preservatives or coating, and which includes in particular such wood waste
originating from construction and demolition waste,
(v) cork waste
Other kinds of biomass (e.g. poultry litter, manure, etc.), on the contrary,
are only utilisable in plants that are formally classified and authorised as
incinerators, which, often, constitutes an important barrier to the development
of these plants.
Besides, different kind of residues (from forestry or agriculture) are, in
principle, classified as waste before they enter the biomass plant and so they
have to be managed according to waste legislation, which entails a specific
authorization and specific competences in the field of waste management for the
power generation company that is running the biomass plant.
Related to this issue, the question of co-firing is to be considered. Co-firing
means that biomass is not the only fuel utilized in the power plant. If the
other fuel is waste derived fuel, then an authorisation for incineration will be
required and incentives (feed-in tariffs or green certificates) will, in
principle, be only assigned to biomass fraction27. Also in the case
of co-combustion with coal, incentives will only be assigned to the biomass
fraction. It is also possible that a certain threshold is defined as minimum
percentage of biomass utilisation.
Incentives to biomass mixed to waste or coal may be lower than those guaranteed
to pure biomass generation, as reported in Table 5, for some EU countries.
Besides, co-combustion plants may be excluded by other complementary measures to
promote green electricity, like fiscal exemptions or guarantees of origin of
renewable electricity. For instance, in the Netherlands, co-combustion do not
qualify for exemption from REB (regulating energy) tax for green electricity
products purchase and REB production subsidy and therefore do not qualify also
for the receipt of green labels.
In UK, co-firing with biomass that attracts ROCs (Renewable Obligation
Certificates) will be subject to increasing restrictions:
- any biomass can be co-fired until 31 March 2009 with no minimum percentage of
energy crops;
- at least 25% of co-fired biomass must be energy crops from 1 April 2009 until
31 March 2010;
- at least 50% of co-fired biomass must be energy crops from 1 April 2010 until
31 March 2011;
- at least 75% of co-fired biomass must be energy crops from 1 April 2011 until
31 March 2016.
Co-firing ceases to be eligible for ROCs after this date.
3.5 Promotion of heat and co-generation
As underlined before, utilisation of biomass for heat production is deemed
to be an important part of bio-energy generation.
Residential and tertiary energy consumption absorbs an important share of EU
final energy uses. About two thirds of this consumption is associated with
heating. So, as regards residential users, there seems to be a possibility of
bioenergy expansion, especially to substitute electricity with biomass and to
provide supply to new users.
Besides, in EU 25 there is almost 50% of steam self production out of total
steam generations. In this sector bioenergy could play an important role in the
future, even only for industries where bioenergy is generated as a by-product
(e.g. in the production of woody products, in the agro-food industry, etc.).
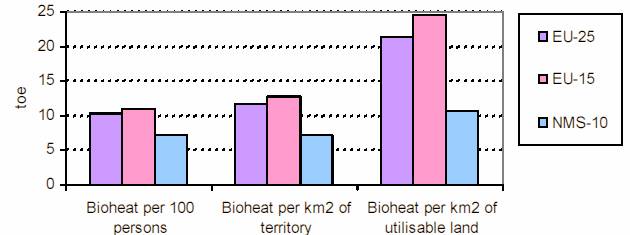
As regards distributed heating, it can be identified a consistent potential in
EU new Member States (NMS), where there is a larger opportunity (with respect to,
e.g., utilisable land) for fossil fuel (coal and oil) substitution with
renewables (biomass) than in EU-15 (Figure 3).
Figure 3: Bioheat generation in EU States, with respect to persons, territory
and utilisable land.
Source: European Biomass Action Plan, External Stakeholders Meeting, 4 March
2005.
Heat-only or electricity-only generation from biomass make already a positive
contribution to European renewable energy, security of supply and Kyoto targets.
For a number of reasons, they may sometimes be the only viable option and in
these cases the construction of heat-only or electricity only installations is
currently promoted in EU Member States.
Nonetheless, the European Cogeneration Directive requires to analyse heat
demands that are suitable for cogeneration from renewables, with a particular
view to cogeneration from biomass.
Amongst other things, this analysis should consider "the type of fuels that are
likely to be used to realise the cogeneration potentials, including specific
considerations on the potential for increasing the use of renewable energy
sources in the national heat markets via cogeneration" (Annex IV of the
Directive).
Two good examples of how an effective biomass co-generation promotion could be
achieved are given by Germany and the Walloon Region in Belgium.
- In Germany, cogeneration installations obtain an additional € 0.02 per
kilowatt-hour of electricity fed into the electricity network (as it is
observable in Table 8), if they burn gas produced from biomass
gasification. This bonus is in addition to the usual remuneration.
- In Belgium, the Walloon Government has introduced a successful "green
electricity certificates" system, under which the use of renewable energy
sources in a cogeneration process is eligible for twice the amount of green
certificates compared with heat-only or electricity-only generation from
renewables.
Two further EC initiatives are contributing to promote heat and co-generation
from renewable sources and especially from biomass:
- the Directive on the energy performance of buildings (2002/91/EC), supporting,
among others, the application of renewable heating applications.
- The Directive on the taxation of energy products and electricity (2003/96/EC),
specifying minimum tax rates and permitting tax exemptions for energy products
and electricity from renewable sources.
An important aspect of bio-heat promotion concerns authorisations for the use of
bio-fuels in civil and residential boilers, a problem already mentioned in the
report. It is often the case that national laws have not yet drawn a clear
distinction between biomass and waste materials, so that for administrative
authorities at local level it is not easy to understand if a biomass residue can
be handled and utilised in residential boilers in a safe and environmentally
sound manner.
Pellets
Compressed wood or other biomass in form of pellets have been studied
throughout Europe and promoted to facilitate the use of biomass at residential
level. However, while the markets for utilising wood pellets in the northern
European countries are well established and still expanding, the markets in
southern Europa are still in their virgin state. In this sense, the success of
wood pellets in European Countries such as Austria, Denmark and Sweden, has yet
to be replicated elsewhere. In Southern European countries, the lack of
available wood waste means that pellets from agricultural residues ("agri-pellets")
are the most promising solution.
In the vast majority of the European countries, there are few or no laws written
specifically for pellets. Often these come under the jurisdiction of only very
general biomass laws.
Presently only few European countries like Austria, Sweden and Germany have
official standards specifically for compacted biomass fuels. Other countries
with significant pellet markets like Denmark and Finland have decided to wait
for the completion of a common European pellet standard. Comprehensive work has
been done on defining standard methods for analysing and classifying pellets and
are defined in the report of CEN/TC 14961. In Table 7 the most commonly
used standards together with the new CEN classification system of pellets are
listed.
Table 7: Standards for pellets.
|
COUNTRY |
STANDARD |
|
Austria |
ÖNORM M1735 (briquettes and pellets) |
|
Sweden |
SS 187120 (pellets) and SS 187121 (briquettes) |
|
Germany |
DIN 51731 (briquettes and pellets) |
|
European Union – CEN TC 335 'Solid Biofuels' |
CEN/TS 14961 "Annex A" Examples of specifications for high quality classes of solid biofuels recommended for household usage |
4 COUNTRY CASES OF RENEWABLE/BIOMASS ENERGY PROMOTION
In this chapter some exemplars of recently adopted policies and regulations
to promote renewable, and especially biomass, energy are presented. These refer
to different EU Member States (Germany, UK, Italy, Belgium) that have planned
and are planning to exploit biomass for energy generation and have thus defined
specific mechanisms to support and encourage this exploitation.
4.1 Revisions of feed-in tariffs for biomass electricity – Germany
In Germany, in 2000, the Renewable Energy Sources Act ("Erneuerbare
Energien-Gesetz", EEG-2000) replaced the Electricity Feed-in Act28.
As a consequence of the developments described above, under the new EEG, feed-in
prices were no longer linked to electricity retail prices, but fixed for 20
years. The cap on the share of electricity from RES was abolished. Instead, the
total amount of feed-in reimbursements were distributed evenly among all high
voltage grid operators and equally among all electricity consumers there.
Furthermore, the feed-in tariffs for some RES such as wind were planned to be
decreased annually for plants installed after 1st January 2002.
The EEG guaranteed preferential prices with respect to the favoured group (the
RES producers), but with the special feature of financing by the end-users of
electricity. The incentive was a positive sanction in the form of guaranteed
payments for the total amount of electricity produced. In the EEG, two important
and innovative features were implemented:
• Decrease of tariffs - supporting technology learning: from 2002 on, new
installations receive lower tariffs. From 2003 on, new installations of these
types receive tariffs lowered at the same rate, and so on for the following
years. This is to retain the incentive for manufacturers to systematically
reduce production costs and to offer more efficient products every year. The
rate of decrease is based on the empirically derived progress ratios (from the
theory of technology learning) for the different technologies.
• Stepped nature of tariffs - supporting financial efficiency: the tariffs for
the different technologies defined in the act are determined based on the yield
/ generation costs of each particular plant. This feature is especially
important for wind energy but applies to other RES as well, e.g. to biomass with
respect to plant size and fuel type. Investors in wind power at sites above a
reference value receive a substantially lower feed-in tariff starting 5 years
after installation. At sites with below average wind yield, the time period for
the higher feed-in tariff is prolonged. This feature leads to a lower level of
promotion at sites with very good wind conditions and higher promotion levels
under less advantageous wind conditions. Therefore the price of the tariff
mirrors the cost resource curve of the technology. This results in a reduction
of the producer profit and therefore in lower transfer costs for society.
Furthermore, the feed-in tariffs are reviewed every two years according to the
new act, first in 2007 and then every four years in the light of technological
and price developments; feed-in tariffs for new sites installed at a later point
in time can be modified accordingly. For every single site, the date of
expiration is twenty years after the date of installation.
Current legislation (amended EEG / August 2004)
In year 2004, a detailed target for the share of renewables in electricity
production of at least 12.5 % (2010) and at least 20 % (2020) was set in order
to underpin the importance of long-term stability of the German RES-E policy.
The revised act intends to improve the integration of RES plants into the
electricity system and provides incentives for operators of RES plants and grid
operators to participate in a power management of RES facilities. Furthermore
the priority right for access and connection to the grid has been enforced.
In the case of bioenergy, the tariffs have been adjusted to increase market
competitiveness, in particular for small-scale biomass plants. Furthermore,
special incentives are provided for the use of innovative technologies, plant/crop-based
renewable resources and CHP.
Table 8: Current tariff structure of the EEG for Biomass, from August 2004.
|
Type of biomass |
General |
Renewable resources [1] |
CHP |
CHP + innovative tech. [2] |
Waste wood from 1.7.2006 |
|
|
Plant dimension |
€/MWh |
Decrease* | ||||
|
< 150 kW |
115 |
175 |
135 |
155 |
39 |
1.5% |
|
150 -500 kW |
99 |
159 |
119 |
139 |
||
|
500 kW - 5 MW |
89 |
129 (114 for wood) |
109 |
129 |
||
|
5 MW - 20 MW |
84 |
84 |
104 |
104 |
||
[1] a) from plants or parts of plants which have originated from agricultural,
silvicultural or horticultural operations or during landscaping activities and
which have not been treated or modified in any way other than for harvesting,
conservation or use in the biomass plant; b) from manure within the meaning of
Regulation (EC) No 1774/2002 of the European Parliament and of the Council, as
amended by Commission Regulation (EC) No 808/2003, or from vinasse generated at
an agricultural distillery pursuant to Article 25 of the Spirits Monopoly Act as
promulgated in the Federal Law Gazette Part III No. 612-7, last amended by
Article 2 of the Act of 23 December 2003 (BGBl. I p. 2924), if that vinasse is
not subject to any other recovery requirements pursuant to Article 25(2) No. 3
or paragraph (3) No. 3 of that Article of the Spirits Monopoly Act or c) from
both substance categories.
[2] "……. if the biomass is converted by thermochemical gasification or dry
fermentation and if the gas used for power generation is processed to reach the
quality of natural gas or if the electricity is produced by fuel cells, gas
turbines, steam engines, organic Rankine cycles, multi-fuel plants, especially
Kalina cycles, or stirling engines……".
* Reduction of tariffs every year for new installed systems.
4.2 Recent advances in biomass energy promotion – Italy: tariffs for
small-scale plants (< 1MWe) and regulation for the use of biofuels in industrial
& civil boilers
In Italy some recently issued decrees, concerning energy sector, fuels
regulation and specifically renewable electricity are contributing to enhance
the diffusion of renewable energy projects, especially biomass.
4.2.1 Tariffs for small-scale renewable power plants
Law 239/04 (on Energy Sector) and Decree 387/03 (for application of
Directive 2001/77/EC on renewable electricity) have introduced concessions and
inventives for small-scale renewable or co-generative29 power plants
(< 1 MWe, also called "distributed generation"). Economic conditions for
purchase of renewable electricity by GRTN (National Transmission Network.
Administrator are presented hereafter (Table 9)
Table 9: Economic remunerations for renewable electricity (Green Certificates
not considered here)
|
Electricity produced by |
Remuneration |
|
< 10 MWe (programmable or not, any date of entering into operation |
Selling price to Distribution Companies, guaranteed miminum price for first and second million of kWh yearly generated by plants < 1 MWe |
|
> 10 MWe non-programmable, put into operation after 1 April 1999*) |
Selling price to Distribution Companies |
|
> 10 MWe non-programmable, put into operation before 1 April 1999*) |
Selling price to Distribution Companies (No Green Certificates) |
|
Hybrid plants < 10 MWe |
Selling price to Distribution Companies for kWh qualified as renewable; for other kWh: selling price to Distribution Companies if plant is cogenerative, otherwise unitary variable cost guaranteed for electricity generated by thermoelectric p lants utilising commercial fossil fuels |
|
> 10 MWe Programmable and hybrid plants |
Price is determined by bids in the electricity market |
* Date of beginning of Green Certificates Scheme
Selling prices to Distribution Companies is determined by Acquirente Unico
(Single Buyer30) in relation to different rate periods or as
undifferentiated prices (average in the period considered). Recently determined
selling prices, together with rate periods for year 2005, are reported in
Table 10.
Table 10: Selling prices to Distribution Companies. Figures for year 2004 and
January 2005
| 2004 | 2005 | |||||||||
| april | May | june | july | august | septemb | octob | novemb | decemb | january | |
| € cents/ kWh | ||||||||||
|
F1 |
10,10 | 10,9 | 10,1 | 12,6 | 16,1 | 13,4 | ||||
|
F2 |
6,6 | 6,7 | 7,4 | 7,1 | 6,6 | 6,6 | 6,6 | 6,6 | 5,6 | 9,1 |
|
F3 |
6,4 | 6,0 | 3,8 | 4,7 | 6,0 | 6,2 | 6,2 | 5,0 | 4,5 | 7,2 |
|
F4 |
3,8 | 3,9 | 4,3 | 4,5 | 4,5 | 4,0 | 3,5 | 3,6 | 4,0 | 4,2 |
| Rate periods 2005 (DELIBERA AEEG 235/04) | ||||||||||||||||||||||||
| MONDAY-FRIDAY | ||||||||||||||||||||||||
| Hours | 0 | 1 | 2 | 3 | 4 | 5 | 6 | 7 | 8 | 9 | 10 | 11 | 12 | 13 | 14 | 15 | 16 | 17 | 18 | 19 | 20 | 21 | 22 | 23 |
| 1-9 January | F4 | F4 | F4 | F4 | F4 | F4 | F4 | F4 | F4 | F4 | F4 | F4 | F4 | F4 | F4 | F4 | F4 | F4 | F4 | F4 | F4 | F4 | F4 | F4 |
| 10 jan-11 mar | F4 | F4 | F4 | F4 | F4 | F4 | F4 | F2 | F2 | F2 | F2 | F2 | F3 | F2 | F2 | F2 | F2 | F2 | F2 | F2 | F3 | F4 | F4 | F4 |
| 14 mar-29 apr | F4 | F4 | F4 | F4 | F4 | F4 | F4 | F3 | F2 | F2 | F2 | F3 | F3 | F3 | F3 | F3 | F3 | F3 | F3 | F3 | F3 | F4 | F4 | F4 |
| 2-31 may | F4 | F4 | F4 | F4 | F4 | F4 | F4 | F3 | F2 | F2 | F2 | F2 | F3 | F2 | F2 | F2 | F2 | F3 | F3 | F3 | F3 | F4 | F4 | F4 |
| 6-30 june | F4 | F4 | F4 | F4 | F4 | F4 | F3 | F2 | F1 | F1 | F1 | F1 | F2 | F2 | F1 | F1 | F1 | F2 | F2 | F2 | F2 | F2 | F4 | F4 |
| 1-29 july | F4 | F4 | F4 | F4 | F4 | F4 | F3 | F2 | F1 | F1 | F1 | F1 | F2 | F2 | F1 | F1 | F1 | F2 | F2 | F2 | F2 | F2 | F4 | F4 |
| 1-5 august | F4 | F4 | F4 | F4 | F4 | F4 | F4 | F3 | F2 | F2 | F2 | F2 | F3 | F2 | F2 | F2 | F2 | F3 | F3 | F3 | F3 | F4 | F4 | F4 |
| 6-21 august | F4 | F4 | F4 | F4 | F4 | F4 | F4 | F4 | F4 | F4 | F4 | F4 | F4 | F4 | F4 | F4 | F4 | F4 | F4 | F4 | F4 | F4 | F4 | F4 |
| 22 aug-16 sept | F4 | F4 | F4 | F4 | F4 | F4 |
F3
|
F2 | F2 | F1 | F1 | F1 | F2 | F2 | F2 | F1 | F1 | F2 | F2 | F2 | F2 | F3 | F4 | F4 |
| 19 sept-18 nov | F4 | F4 | F4 | F4 | F4 | F4 | F4 | F3 | F2 | F2 | F2 | F3 | F3 | F3 | F3 | F2 | F2 | F2 | F2 | F3 | F3 | F4 | F4 | F4 |
| 21 nov-7 dec | F4 | F4 | F4 | F4 | F4 | F4 | F4 | F3 | F2 | F2 | F2 | F2 | F3 | F3 | F2 | F2 | F1 | F1 | F2 | F2 | F3 | F4 | F4 | F4 |
| 12-23 december | F4 | F4 | F4 | F4 | F4 | F4 | F4 | F3 | F2 | F1 | F1 | F2 | F3 | F3 | F2 | F2 | F1 | F1 | F2 | F2 | F3 | F4 | F4 | F4 |
| 24-31 december | F4 | F4 | F4 | F4 | F4 | F4 | F4 | F4 | F4 | F4 | F4 | F4 | F4 | F4 | F4 | F4 | F4 | F4 | F4 | F4 | F4 | F4 | F4 | F4 |
| SATURDAY-SUNDAYAND WEEK HOLIDAYS (*) | ||||||||||||||||||||||||
| 1 gen-31 dic | F4 | F4 | F4 | F4 | F4 | F4 | F4 | F4 | F4 | F4 | F4 | F4 | F4 | F4 | F4 | F4 | F4 | F4 | F4 | F4 | F4 | F4 | F4 | F4 |
| (*) 1-6 january, easter monday, 25 april, 1 may, 2-3 june, 15 august, 31 october, 1 november, 8, 9, 25 and 26 december | ||||||||||||||||||||||||
As mentioned in Table 9, for renewable power plant < 1 MWe (including waste to
power plants and excluding hybrid plants), there are minimum guaranteed prices
for the first two millions of kWh generated, which are defined for different
brackets:
- For first 500.000 kWh (generated per year): 95 € / MWh;
- From over 500.000 to 1.000.000 kWh: 80 € / MWh;
- From over 1.000.000 to 2.000.000 kWh: 70 € / MWh;
- Over 2.000.000 kWh: selling price to distribution companies (per rate period
or undifferentiated)31.
4.2.2 Regulation for the use of biofuels in industrial and civil boilers
The Decree of the President of the Council of Ministers 8th March 2002 (DPCM
08/03/2002) establishes the characteristics of fuels for industrial32 and civil
combustion plants, as well as some technical plant specification.
This decree includes a specific section for "Biomass", which has emerged as very
important to regulate and also to promote the use of biofuels in energy (electricity
and heat) generation.
Typologies of biomass enumerated in this section are:
(a) Vegetal material deriving from dedicated crops;
(b) Vegetal material deriving from exclusively mechanical treatment of
agricultural non-dedicated crops;
(c) Vegetal material deriving from silvicultural interventions, forestry
maintenance and pruning;
(d) Vegetal material deriving from exclusively mechanical treatment of virgin
wood and consisting of barks, sawdust, shavings, chips, edgings, billets,
granulated and rejected virgin wood, granulated and rejected virgin cork,
non-contaminated billets;
(e) Vegetal material deriving from exclusively mechanical treatment of
agricultural products.
In the decree, conditions for the utilisation of biomass in combustion plants
are given, together with emission limits, depending on plant dimensions (Tables
11 and 12).
Table 11: DPCM 08/03/2002, Emissions limits for Biomass combustion.
|
|
≥ 35 ÷ ≤ 150 kW |
> 0,15 ÷ ≤ 3 MW |
> 3 ÷ ≤ 6 MW |
> 6 ÷ ≤ 20 MW |
> 20 |
||
|
|
(mg/Nm3 , O2 @ 11%) |
||||||
|
Particulate matter |
200 |
100 |
30 |
30 |
30 |
10 |
|
|
TOC |
- |
- |
- |
30 |
20 |
10 |
|
|
CO |
- |
350 |
300 |
250 |
150 |
200 |
100 |
|
NOxi |
- |
500 |
500 |
400 |
300 |
400 |
200 |
|
SOxi |
- |
200 |
200 |
200 |
200 |
||
|
i Expressed as NO2 and SO2 respectively |
|||||||
|
|
|
Hourly average |
|
Daily average |
|
||
Table 12: Further controls required by DPCM 08/03/2002 to ensure, in normal
working conditions, respect of emissions limits.
|
|
1-3 MW |
3-6 MW |
6-20 MW |
> 20MW |
|
Fuel automatic feeling system |
MANDATORY |
|||
|
Continuous measurement in combustion chamber (T, O2) and automatic regulation of air/fuel |
|
MANDATORY |
||
|
Pilot burner |
|
|
MANDATORY |
|
|
Continuous measurement: T, CO, NOx, steam |
|
|
MANDATORY |
|
|
Continuous measurement: dust, TOC |
|
|
|
MANDATORY |
Recently, a revision of the decree has been necessary to explicitly include a
biomass material (olive pomace) which is subject to a non-mechanical treatment (process
with hexane) that, however, do not compromise an environmentally sound
utilisation in civil or industrial boilers33.
4.3 Introduction of Green Certificates for renewable electricity based on CO2 emissions – Walloon Region, Belgium
In Wallonia the green certificate system came into effect on October 1st 2002.
The quota for the first obligation period ending on 31 December 2003 was set at
3%. This percentage will increase by one point per year till 2007 – 4% in 2004,
5% in 2005, 6% in 2006 and 7% in 2007.
A Green Certificate is assigned for a given quantity of avoided CO2 emissions (1
GC = 456 kg CO2 avoided), compared with the best reference technologies34, and
through the use of:
- a renewable energy source (production of electricity)
- a cogeneration unit,
which means one green certificate per MWh for wind, small-hydro, biomass (in
principle) or solar PV but 3.3 MWh for a natural gas cogenerator and 6.2 MWh for
a fuel oil cogenerator.
Green certificates are valid for five years. Those suppliers which fail to reach
each quarter the annual quota are obliged to pay a fine per green certificate
missing (75 € till 30 june 2003 and 100 € thereafter). The amount of the fine
indicates the theoretical ceiling price of the certificates.
Thus, there is a Single Green Certificate mechanism for quality cogeneration and
electricity from renewable energy sources. This permits to have greater
liquidity of the Green Certificates’ market and the possibility to integrate
complex processes (different types of fuel, hybrid installations, renewable or
non renewable fuels, partially or fully combined with cogeneration, etc. ).
It also raises the need for a common denominator of CO2 saving.
As regards biomass, it can be noted that conventional CO2 emissions are
different for diverse categories of materials, as reported in Table 13.
Table 13: CO2 emissions coefficients of primary energy sources defined in
Wallonia GC scheme.
|
Energy Sources |
Conventional value (kg CO 2/MWhp) |
|
FOSSILE |
|
|
Gas |
251 |
|
Diesel |
306 |
|
Light/medium/heavy fuel oil |
310 |
|
Extra heavy fuel oil |
320 |
|
Coal |
385 |
|
NON FOSSILE |
|
|
Wind/photovoltaic/organic biodegradable materials* |
0 |
|
Wood grown for energy destinations |
45 |
|
Other types of wood |
23 |
|
* NOTE: if necessary, the following elementary operations associated with the preparation of the organic materials will be also considered |
|
|
Operation |
Conventional value (kg CO 2/MWhp) |
|
Cutting of wood |
4 |
|
Drying of wood |
10 |
|
Transportation of wood on a distance of less than 100 km |
5 |
It can be noted that there are some difference with respect to the recent German
legislation (see 4.1) on renewable electricity promotion. In Germany only
non-treated plants from agricultural/silvicultural operations (so-called
renewable resources) plus manure and vinasse are subject to the best conditions
(not considering CHP option), whereas in Belgium all organic biodegradable
materials are considered as carbon neutral. Wood energy crops are, furthermore,
in Belgium, less subsidised than wood residues because of associated CO2
emissions, while in Germany they (as renewable resources) are more remunerated.
4.4 Recent advances in biomass energy promotion – UK
In UK, current scheme for renewable electricity promotion, which is a renewable
certificates scheme (Renewables Obligation Order 2005), permits qualification
and attribution of certificates (to the biomass fraction) to plants which
utilise "mixed" waste (biomass and non-biomass waste) only if the fraction of
non-biomass waste is treated by means of Advanced Conversion Technologies, that
is gasification, pyrolysis or anaerobic digestion (or any combination thereof).
Besides, fiscal and other incentive schemes for bio-heat generation are being
discussed.
5 CONCLUSIONS AND RECOMMENDATIONS
As underlined in previous paragraphs, European policy for biomass energy
utilisation is primarily based on economic incentives to support different types
of initiatives, i.e. fiscal incentives for thermal application and feed-in
tariffs / green certificates for power production. In addition CDM mechanisms
can be applied to increase financial viability of projects. Nonetheless, also
other complementary policies (research on crops, research and demonstration of
conversion technologies, standardisation of biofuels/waste, agriculture/forestry
plans and regulations, plants authorisation procedures) are extremely important
to create the conditions for a real growth of biomass sector. Therefore, these
arguments should be considered in detail also when analysing problems and
opportunities for the development of biomass energy in Sri Lanka and SE Asia.
Particularly, the issue of tariffs to be established for biomass electricity is
extremely relevant and needs to be studied thoroughly.
Accordingly, most important key issues to be considered are:
» Necessity to study different pricing mechanisms for biomass electricity
o avoided cost of fuels and capacity charge are two components of electricity
tariff that have to be correctly valued and applied to biomass power plants,
considering plant scale but also grid-specific situations. For example a
capacity charge for small power plants (< 5 MWe) could be applied in particular
cases and an avoided cost of electricity transport could be applied if the plant
is feeding a distribution network without connecting to transport network
» Necessity to study legislation and regulations that can favour a correct
utilisation of biomass
o classification of land available for short rotation coppicing
o utilisation of agricultural residues (e.g. rice husks, coconut shells, etc.)
for energy production
» Necessity to increase average installed power per unit (e.g.
> 10 MWe) for
biomass power plants, to exploit higher efficiencies
o necessity to promote regular, contract-based supply of wood between farmers
and power plants
o necessity to foster investments and to, possibly, allow investments from
abroad (that might be connected to highly-efficient technology supply) by
defining clear investment and taxation rules
» Necessity to better understand feasibility and benefits of specific
interventions, like industrial co-generation, off-grid village schemes based on
biomass power generation, replacement of conventional low-efficiency domestic
stoves
o as underlined by CEB (Ceylon Electricity Board)35, initiatives that are,
without any economic assistance, economically convenient can right away foster
the development of biomass sector and put the premises for future better
conditions for power generation, especially in the industrial sector whereas a
relevant demand of energy (e.g. steam) is required and then a significant demand/supply
of biomass can be generated. Besides, these initiatives can reduce energy costs
for industries.
o other initiatives could avoid the development of problematic and costly grid
connections towards some not easily reachable villages and could reduce wood
consumption and pollution at domestic level. These opportunities are to be
studied thoroughly, also in view of potential support by CDM credits and by
means of:
■ analysis of centralised/connected vs. distributed generation, in terms of cost/efficiency,
availability of skilled workers, creation of jobs in rural areas, availability
of biomass and logistics problems for supply.
■ analysis of environmental improvement and of avoided costs in domestic cooking
(also for wood procurement). Development of a widespread and relevant biomass
demand (for industries/power generation) would result in a significant
opportunity cost36 of biomass used for cooking that might make it convenient to
invest in more efficient stoves.
»
Necessity to better understand possibilities for biomass CDM projects
o Necessity to thoroughly understand CDM rules on additionality and on possible
replications of projects
o Necessity to appreciate costs of different reduction options (renewables, and
in particular biomass; energy efficiency; waste recovery, etc.)
o Necessity to enhance links with European countries and with EU carbon credits
market and correspondingly identify CDM projects interesting for EU actors
In view of all the above-mentioned issues that need to be addressed, it is
deemed essential to form working groups that, by means of a correct balance of
technical, political and academic competences and experiences, may, starting
from the conference, study and analyse all these substantial themes in order to
provide guidelines and manuals for a proper bioenergy exploitation in Sri Lanka
and SE Asia.
Working groups should be working on the two following general themes:
■
Policy measures for biomass-based electricity production in Sri Lanka, to
draft proposals regarding biomass electricity pricing and other complementary
measures (organisation and support of biomass supply, regulations to correctly
produce and utilise biomass, rules to encourage investments) that could also
foster other important biomass energy uses (industrial & domestic)
■
Analysis of different CDM project-types (renewable energies like biomass,
biogas; waste recovery; forestation), to identify concrete cases that might be
adequate to set up bilateral EU-Sri Lanka agreements.
BIBLIOGRAPHY
Renewable energy Policies
»
Bechberger, Mischa/Reiche, Danyel (2003): Renewable energy policies in an
enlarged European Union, in: Refocus September/October 2003, p. 30-34.
»
Directorate-General for Transport and Energy (of the European Union) (DG TREN),
2003. European Energy and Transport Trends to 2030 (Summary Energy Balances and
Indicators, Appendix 2), Brussels.
»
EurObserv’ER, 2002. ‘‘Baromčtre européen 2001, le bilan 2001 des énergies
renouvelables’’, Systčmes Solaires, No. 148.
»
European Commission (EC), 2000. MANDATE TO CEN FOR STANDARDISATION IN THE
FIELD OF SOLID BIOFUELS, M/298. Brussels, July 17th.
»
European Commission (EC), 2003. Regulation 808/2003 amending Regulation (EC)
No 1774/2002 of the European Parliament and of the Council laying down health
rules concerning animal by-products not intended for human consumption. Brussels,
May 12th.
»
European National Governments, 2003. Fourth Ministerial Conference on the
Protection of Forests in Europe (MCPFE, 2003). Vienna, April.
»
European Union (EU), 1997. Energy for the Future: Renewable Sources of Energy,
White Paper for a Community Strategy and Action Plan, Brussels, November.
»
European Union (EU), 2001: Community guidelines on State aid for environmental
protection. OJ C 37. Brussels. February 2001. These guidelines will cease to be
applicable on 31 December 2007.
»
European Union (EU), 2001. Directive 2001/77/EC of the European Parliament and
of the Council on the Promotion of Electricity Produced from Renewable Energy
Sources in the Internal Electricity Market, Brussels, August.
»
European Union (EU), 2002. Directive 2002/91/EC of the European Parliament and
of the Council on the Energy Performance of Buildings, Brussels, December.
»
European Union (EU), 2003. Directive 2003/30/EC of the European Parliament and
of the Council on the promotion of the use of biofuels and other renewable fuels
for transport, Brussels, May.
»
European Union (EU), 2003. Council Directive 2003/96/EC restructuring the
Community framework for the taxation of energy products and electricity,
Brussels, October.
»
European Union (EU), 2003. Council Regulation (EC) No 1782/2003 of 29
September 2003 establishing common rules for direct support schemes under the
common agricultural policy and establishing certain support schemes for farmers
and amending Regulations (EEC) No 2019/93, (EC) No 1452/2001, (EC) No 1453/2001,
(EC) No 1454/2001, (EC) 1868/94, (EC) No 1251/1999, (EC) No 1254/1999, (EC) No
1673/2000, (EEC) No 2358/71 and (EC) No 2529/2001.
»
European Union (EU), 2004. Directive 2004/8/EC of the European Parliament and
of the Council on the Promotion of Co-generation based on a useful heat demand
in the internal energy market, Brussels, February.
»
German National Parliament (Bundestag), 2000. Act on Granting Priority to
Renewable Energy Sources (Renewable Energy Sources Act ) Berlin, March 29th.
»
Hoogwijk, M., 2004. On the Global and Regional Potential of Renewable Energy
Sources, Ph.D. thesis, Utrecht University, Utrecht, the Netherlands, 12 March,
256 pp. (ISBN: 90-393-3640-7).
»
International Energy Agency (IEA), 2002. World Energy Outlook – 2002, Paris.
»
International Energy Agency (IEA), 2003. World Energy Investment Outlook --
2003, Paris.
»
Italian Government, 2002. Decree of the President of the Council of Ministers
(DPCM 08/03/2002) on the control of the characteristics of fuels important for
atmospheric pollution and of technological characteristics of combustion systems.
Rome, March 8th.
»
Italian Parliament, 2004. Law 239/2004 on the reorganisation of the energy
sector. Rome, August.
»
Jochem, E., Favrat, D., Hungerbühler, K., von Rohr, P.R., Spreng, D., Wokaun,
A., and Zimmermann, M., 2002. Steps Towards a 2000 Watt Society; Developing a
White Paper on Research and Development of Energy Efficiency Technologies, PSI, EPFL, ETH Zürich, and EMPA, Zürich.
» Johansson, T.B., McCormick, K., Neij, L., and Turkenburg, W.C., 2004. ‘‘The
potentials of renewable energy’’, thematic background paper for the
International Conference for Renewable Energies, Bonn, Germany, June 1-4.
»
Meyer, N.I., 2003. ‘‘European schemes for promoting renewables in liberalised
markets’’, Energy Policy, 31, pp. 665-676.
»
Macchi-Chiesa-Bregani, 2003, "Italian electricity sector: what alternatives
and costs to comply with Kyoto protocol targets?", Polytechnic of Milan – CESI.
»
Nakicenovic, N., Alcamo, J., Davis, G., de Vies, B., Fenhann, J., Gaffin, S.,
Gregory, K., Grübler, A., Yong Jung, T., Kram, T., Lebre la Rovere, E.,
Michaelis, L., Mori, S., Morita, T., Pepper, W., Pitcher, H., Price, L., Riahi,
K., Roehrl, A., Rogner, H.-H., Sankovski, A., Schlesinger, M., Shukla, P., Smith,
S., Swart, R., van Rooijen, S., Victor, N., and Dadi, Z., 2000. Special Report
on Emission Scenarios, Special Report of Working Group III of the
Intergovernmental Panel on Climate Change (IPCC), Cambridge University Press,
Cambridge, United Kingdom, 2000.
»
Reiche, Danyel (2002): Renewable energies in the EU Member States in
comparison, in: Reiche, Danyel (2002) (ed.): Handbook of Renewable Energies in
the European Union, Frankfurt/Main, p. 13-24.
»
Reiche, Danyel (2003): Renewable energies in the Accession States, in: Reiche,
Danyel,(2003) (ed.): Handbook of Renewable Energies II – Case Studies of all
Accession States, Frankfurt/Main, p. 13-30.
»
UK Parliament, 2005. The Renewables Obligation Order 2005 (the Order extends
to England and Wales only). London, April 1st.
»
UN-ECE/FAO Temperate and Boreal Forest Resource Assessment, 2000.
»
Walloon Government, 2002. Decision concerning the promotion of green
electricity, Namur, July 4th.
- http://www.agores.org
- http://www.bioenergy-noe.com
- http://www.elsevier.com/wps/find/journaldescription.cws_home/986/description
- http://www.eubia.org/Projects.htm
- http://www.eubionet.net/
- http://www.greenprices.nl
- http://www.novem.org/biofinance/html/intro.html
- http://www.senternovem.nl/react/20_documents_and_links/index.asp
Abbreviations.
The subject of this report is derived from newly implemented legal processes
that have introduced new terms that are constructed from ordinary words, but
which have special meanings. These terms are often referred to by the following
abbreviations (which are used herein for both the singular and plural forms of
the terms):
CCL - the UK’s Climate Change Levy.
CCPO = the UK Government’s Climate Change Projects Office.
CDM = the Clean Development Mechanism – a means within the KM to include those
developing countries that are listed in Annex 2 of the Kyoto Protocol in the
drive to reduce emissions of GHG.
CER = Certified Emission Reductions - verified credits granted to validated
projects that can be sold on the carbon-market that can provide an extra
income-stream for eligible projects in developing countries.
CO2e = Carbon Dioxide Equivalent – the effect of six GHG on global warming
expressed in terms of their equivalence in this respect to carbon dioxide..
DOE = Designated Operational Entity – a body that has been approved by UNFCCC to
validate a PDD, and/or to verify CER. For any particular project, separate DOE
are required for these two functions.
EB = Executive Board – the arm of UNFCCC that deals with CDM.
EU-ETS = the European Union’s Emissions Trading Scheme.
GHG = the so-called “Greenhouse gases”, which are a cause of global warming. The
UNFCCC’s systems cover six GHG, which are measured, for the purposes of the
CDM,
in units of CO2e.
IET = International Emissions Trading - a system to give market-value to CER,
etc.
JI = Joint Implementation – a KM similar to CDM, but applicable to countries
listed in Annex 1 of the Kyoto Protocol.
KM = Kyoto Mechanisms.
PDD = Project Design Document – a description of the proposed project that
starts the legally secure process towards gaining CER.
UNFCCC - the United Nations’ Framework Convention on Climate Change.
WBPCF – the World Bank’s Prototype Carbon Fund.
______________________
* Paper for the
conference "issues for the sustainable use of biomass resources for energy",
Colombo, 15-19th august 2005. ASIA PRO-ECO PROJECT "The way forward for the use
of wood and agricultural waste for energy production in S.E. Asia".
♦
Prof. Engineer, Director of the Department of Applied Sciences to Complex
Systems of the Technical University of Marche (Italy)
◊
Engineer, Italian Thermo-technical Committee (CTI) - Research Sector
1 The gradual phasing out of nuclear energy in several Member
States will increase the Community’s energy dependency on extra-EU sources.
2 Besides, in Europe concerns remain about environmental
pollution, especially small particulates in the air (the so-called PM 10 and PM
2.5, particles with a diameter smaller than 10 and 2.5 micrometres, respectively)
and other pollutants being estimated to cause significant damage (e.g. NOx,
polycyclic aromatic hydrocarbons - PAH, etc.).
3 Under the Kyoto Protocol (Article 4, 1997) parties are allowed
to meet their commitments jointly.
4 Overall competitiveness is also being promoted through
liberalisation of the EU electricity and gas markets as well as by separation of
energy production, transportation, and distribution activities. For fostering
competitiveness of the EU economy and concomitant income and added value
creation, the promotion of one internal market at Union level is considered
essential. Cross-border trade on level playing-field terms would foster
competition.
5 IEA is more optimistic for renewables development, projected
at 11% (2% hydro + 9% others) of total demand in year 2030.
6 The total investment in renewables over the period 1997-2010,
required to reach the aforementioned EU objective is put at € 165 billion. Some
58% (€ 95 billion) would be ‘incremental’, i.e. accounted for by the higher
investment cost of renewables.
7 In this view, completion of the internal market will stimulate,
among others, gas-to-gas competition. This, in turn, may lead to an uncoupling
of the price of gas from the price of oil, which is subject to high fluctuations.
8 EU legislation defines renewable energy as all non-fossil
sources, including biogases, biomass, geothermal, hydro-power, landfill gas,
sewage treatment plant gas, solar and wind. In particular, electricity is
classified as being produced from RES if it is obtained from plants using solely
renewable energy sources, as well as the proportion of electricity produced in
hybrid plants that use conventional energy sources.
9 Directive 2001/77/EC of the European Parliament and of the
Council of 27 September 2001 on the promotion of electricity produced from
renewable energy sources in the internal electricity market.
10 Directive 2003/30/EC of the European Parliament and of the
Council of 8 May 2003 on the promotion of the use of biofuels and other
renewable fuels for transport
11 The RES-E directive sets indicative targets for the share of
RES-E in total electricity consumption at Union and Member State levels, broadly
in accordance with the white Paper target fixed in 1997. If the overall share of
renewable energy sources in total primary energy supply in the EU is to reach
12% in year 2010, within that year the renewable energy share in electricity
consumption has to be 22.1%. The latter objective is broken down into a
differentiated indicative (non-binding) percentage for each Member State.
12 Directive 2002/91/EC of the European Parliament and of the
Council of 16th December 2002 on the energy performance of buildings.
13 Directive 2004/8/EC of the European Parliament and of the
Council of 11 February 2004 on the promotion of cogeneration based on a useful
heat demand in the internal energy market.
14 Substantial cost reductions can still be achieved for most
technologies. However, making these RETs fully competitive will require further
research, technology development and market deployment and an increase in
production capacities to mass production levels [Johansson et al., 2004].
15 European Union (2001): Community guidelines on State aid for
environmental protection. OJ C 37. Brussels. February 2001. These guidelines
will cease to be applicable on 31 December 2007.
16 Explicit reference is made to the possibility of state aid
for promoting the use of renewable sources of energy and combined heat and power
production by way of tax exemptions or reductions [Point 24]. ‘‘Where it can be
shown to be necessary’’ investment grants in support of renewable energy up to
100% of the eligible costs[3] are possible, although in this case, the
installations concerned will not be entitled to receive any further support [Point
32]. The Commission should be notified of this aid by the member state concerned
and re-notified every 10 years. It is then up to the discretion of the
Commission to determine on a case-by-case basis whether or not the support
measures concerned are not in breach of any Union legislation and approve/reject
the decision accordingly.
Operating aid may be justified to cover the difference between the cost of
producing energy sources and the market price for energy [Point 56]. Furthermore,
state aid justified by avoided external costs is not allowed to exceed 0.05
euro/kWh.
17 Support schemes: "1. Without prejudice to Articles 87 and 88
of the Treaty, the Commission shall evaluate the application of mechanisms used
in Member States according to which a producer of electricity, on the basis of
regulations issued by the public authorities, receives direct or indirect
support, and which could have the effect of restricting trade, on the basis that
these contribute to the objectives set out in Articles 6 and 174 of the Treaty."
18 Green certificates can be defined in terms of advantages and
disadvantages with respect to feed-in tariffs. Advantages are: 1) efficiency
improvements show up in GC-prices directly; 2) strong regulation of capacity
development; 3) no governmental subsidisation - the consumers are going to pay;
4) international trade with green certificates is possible. Disadvantages are:
1) only the most competitive renewable technology is promoted; 2) the national
market should have a minimum volume; 3) higher investment risk: The GC market
comprises both market risk and reliability of politicians; 4) uncertainty on how
green certificates interplay with other greenhouse gas reduction instruments
19 However, in the Mandate it is underlined that a material
fulfilling certain standard specifications does not automatically qualify as a
product.
20 The EU Directive on Bio-fuels will help the farmers to
develop some of such crops.
21 Council Regulation 1782/2003 of 29. September 2003,
published in OJ L 270 from 21.10.2003.
22 At the moment, set-aside rate of 10% (compulsory rate)
results in EU15 area of about 4 million ha. In the year 2004/05 there has been a
temporary reduction to 5% (2 millions ha). In addition, voluntary set-aside was
about 2.3 million ha in 2003/04. Set-aside land currently used for energy crops
was about 0.9 million ha in 2003. 2/3 of energy crop production on set-aside
consists of oilseeds in France and Germany. Other important producers are UK,
Spain and Denmark. Establishment of set-aside entitlements will be done on the
basis of historic references within the single farm payment scheme. Set-aside
entitlements shall be activated only if accompanied by an eligible hectare put
into set-aside (excluding permanent grassland). Set-aside areas must cover at
least 0.1 hectare in size and be at least 10 meters wide (for duly justified
environmental reasons a width of 5 meters may be accepted). Area under set-aside
may be subject to rotation. Organic producers will be exempt from the set-aside
obligation.
23 European Biomass Action Plan, External Stakeholders Meeting,
4 March 2005, "Common Agricultural Policy Perspectives for Biomass Production".
Willi Schulz-Greve, unit G.1 - Studies and overall approach - European
Commission - DG Agriculture
24 Commonwealth of Independent States. All of the former
republics of the USSR except the Baltic states had become members of the CIS.
25 OWL: permanent status characterized by presence of > 10 %
crown cover < 5 m height at maturity (scrub, maquis, matorral etc..) or 5-10 %
crown cover > 5 m height at maturity ( wooded pasture – agroforestry systems ).
FOREST : crown cover > 10 % and mature height > 5 m , including clearings ,
cuttings streams and water bodies.
26 Directive 2001/77/EC on renewable electricity, for instance,
claims that:
1. Member States or the competent bodies appointed by the Member States shall
evaluate the existing legislative and regulatory framework with regard to
authorisation procedures or the other procedures laid down in Article 4 of
Directive 96/92/EC, which are applicable to production plants for electricity
produced from renewable energy sources, with a view to:
— reducing the regulatory and non-regulatory barriers to the increase in
electricity production from renewable energy sources,
— streamlining and expediting procedures at the appropriate administrative level,
and
— ensuring that the rules are objective, transparent and non-discriminatory, and
take fully into account the particularities of the various renewable energy
source technologies.
2. Member States shall publish, not later than 27 October 2003, a report on the
evaluation referred to in paragraph 1, indicating, where appropriate, the
actions taken. The purpose of this report is to provide, where this is
appropriate in the context of national legislation, an indication of the stage
reached specifically in:
— coordination between the different administrative bodies as regards deadlines,
reception and treatment of applications for authorisations,
— drawing up possible guidelines for the activities referred to in paragraph 1,
and the feasibility of a fast-track planning procedure for producers of
electricity from renewable energy sources, and
— the designation of authorities to act as mediators in disputes between
authorities responsible for issuing authorisations and applicants for
authorisations.
27 In some cases, e.g. Italy, the same incentive as for
renewables is assigned to waste combustion, to favour development of this
technology.
28 The Electricity Feed-in Act was introduced in 1991. It
mandated that grid operators pay 80 % of (average historical) electricity retail
prices as feed-in tariffs for electricity generated by certain Renewable Energy
Sources (RES). Furthermore, it required electricity suppliers to accept the
electricity fed into the grid. The Electricity Feed-in Act in its later stage
had a cap to prevent very uneven burdens for regional grid operators: a grid
operator had to pay these feed-in prices until the share of electricity from RES
reached the cap of 5 %. Nevertheless, this regulation still had an asymmetric
impact on the utilities operating the grid. For example, the wind turbines which
benefited most under the Energy Feed-in Law are concentrated in Northern Germany.
Thus, grid operators in the North were at a (slight) competitive disadvantage,
which caused a problem, especially after electricity market liberalisation.
Furthermore, the falling electricity (retail) prices resulting from
liberalisation also led to lower feed-in prices for electricity from RES. This
started to undermine their economic basis, in particular that of the numerous
wind turbines which had been installed in the previous years. Thus, an intensive
debate arose about the future of the Electricity Feed-in Act.
29 According to Law 239/2004, micro-cogeneration plants (< 1
MWe) are subject to simplified authorisation procedures.
30 It is the company which is vested with the task of procuring
electricity for captive customers under criteria of continuity, security and
efficiency of electricity supply, thereby passing the benefits from
liberalisation of the sector onto such customers.
31 40% of these prices are updated yearly according to ISTAT
index (consumer prices index), to take into account inflation rate.
32 Industrial plants include power plants.
33 A further revision might be, in this sense, required for
other materials, like, e.g., grape pomace, which, though not contaminated, are
processed in non-strictly mechanical processes and then often are treated as
waste excluded from the application of the decree by local administrative
authorities, the ones that must release authorisations for biomass utilisation.
34 Generation of 1 MWhe in a combined cycle power plant (with
reference to STAG technology, i.e. trade name designation for the GE product
line of combined-cycle systems) fuelled by natural gas, with 55% efficiency,
produces 456 kg of CO2 ( 124 kg of C)
35 During a private meeting with BEASL and CTI representatives.
36 Opportunity cost is a term used in economics, to mean the
cost of something in terms of an opportunity foregone (and the benefits that
could be received from that opportunity), or the most va
Pubblicato su
www.ambientediritto.it il 15/10/2006